
Alternative beta is not beta
By Simon Savage, Director of Alternative Beta, Man Group
Published: 13 April 2017
Introduction
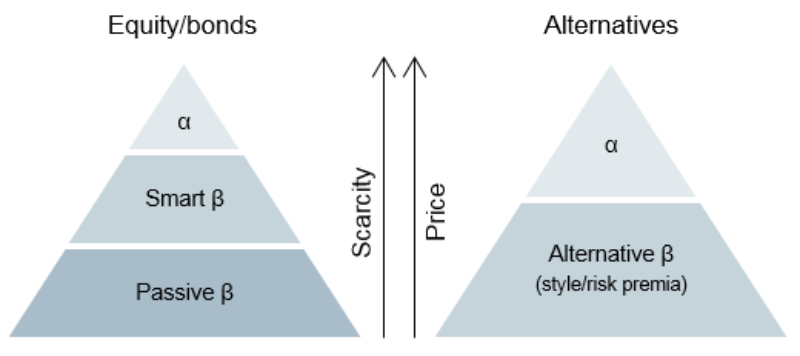
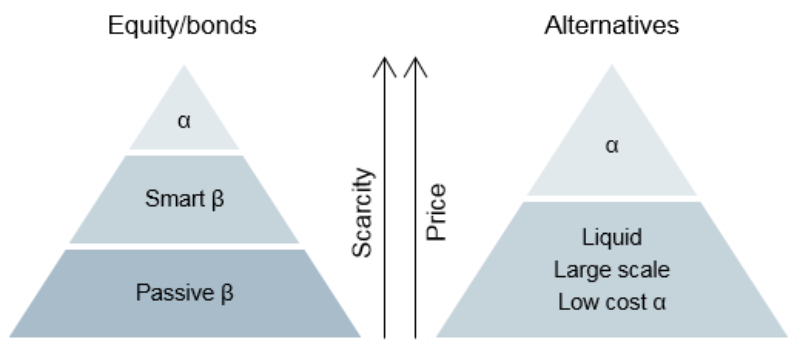
Finance is an industry where the importance of words has often been marginalised. On a trivial level, this has led to a cottage industry in confusing, and often absurd-sounding jargon. In some areas, however, the lack of clear language is not only annoying, but potentially dangerous, and Alternative Beta is a pressing example. For many investors we speak to, products associated with the term ‘beta’ imply returns that are clustered around a clearly identifiable core asset or benchmark. This is generally applicable for long-only mandates. As per the schematic in figure 1, passive beta will replicate a pre-defined benchmark index (e.g. iShares MSCI World) and smart beta will express a particular factor tilt within that universe (e.g. iShares Edge MSCI World Value) leaveing alpha as the scarce skill of generating truly idiosyncratic returns.
This product schematic breaks down when we try to adapt this long-only model to fit alternative return strategies.
One of the primary differences between long-only strategies and alternatives is that alternatives are significantly less constrained meaning they can more freely seek to exploit the investment opportunities created by market inefficiencies. These opportunities can be divided into two broad categories: alpha strategies and ‘style’ or ‘risk premia’ strategies. Alpha strategies are those that require deep investment skill, can access difficult to trade markets, are capacity constrained or require specialist structuring insight. Style or risk premia are strategies that are more generic in nature and have high capacity and liquidity. As is indicated in figure 1, it is tempting to group these strategies under the collective name of ‘Alternative Beta’ to mirror the established classification model applied to traditional assets. In this article we argue that this would be a mistake. While we believe it is appropriate to associate Alternative Beta with larger capacity, higher liquidity and lower fees, it is not, however, ‘beta’ in the sense that the performance of these strategies can be considered explained by specific market environments.
The first section contrasts the return dispersion observed in traditional and Alternative Betas. Next we suggest some explanations for the differences seen, before finally offering an idea for how we believe investors could better understand these products.
Figure 1. Alt Beta’s place in the investing universe
Traditional vs Alternative Beta
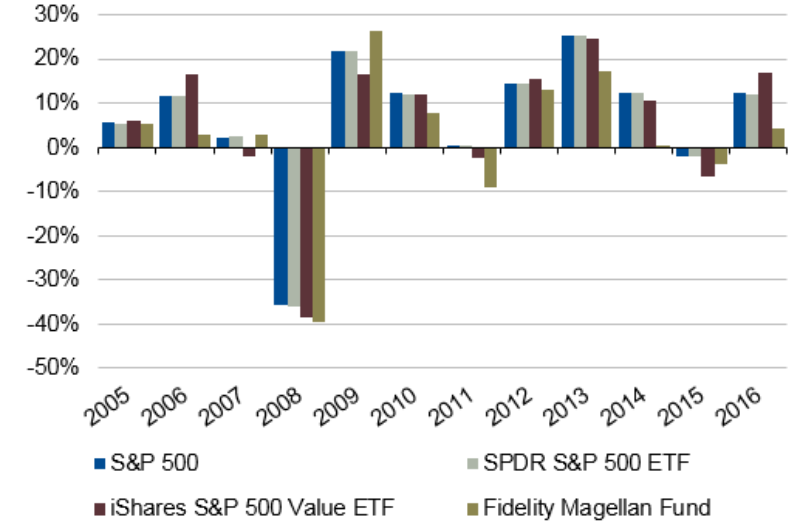
The case for traditional asset beta is well established, easy to demonstrate and therefore readily applied to investing. Figure 2 shows the annual performance of three different US portfolios against a benchmark S&P 500 index in blue. The SPDR S&P 500 ETF represents passive beta, or the base of the left hand triangle discussed in figure 1. As can be seen this experiences returns which are almost identical to the index, but for adjustments such as fees and construction costs.
This beta persists as we go up the triangle. The iShares S&P 500 Value ETF is an example of what we consider a smart beta portfolio – it owns the same universe of stocks as the SPDR fund, but according to certain pre-determined rules, tilting to buy more of the stocks with cheaper valuations. This alteration in construction causes some slight deviation in annual returns but the market remains the dominant explanatory factor of performance. Finally, even the USD13bn Fidelity Magellan fund, one of the most recognised names in active management, shows performance that is also significantly influenced by the market.
There is no surprise here to us, as we would anticipate the historical returns of these funds to be largely explained by the prevailing environment, being positive in a bull market and negative in a bear market. We believe this simple observable fact has been driving the unrelenting rise in allocation to passive funds as offering the most efficient method of achieving the core asset class return objectives.
It would be ideal if we could find similarly cost efficient strategies to produce the core returns for the universe of non-traditional assets, so called ‘alternatives’. So it is understandable for investors to turn to products labelled ‘Alternative Beta’ for the solution, but is that wholly appropriate?
Figure 2. Illustration of traditional beta using annual performance of three funds versus S&P 500 index
In the universe of alternative strategies a framework of categorising investment styles has emerged that is summarised in figure 3.
Figure 3. Alternative risk factors

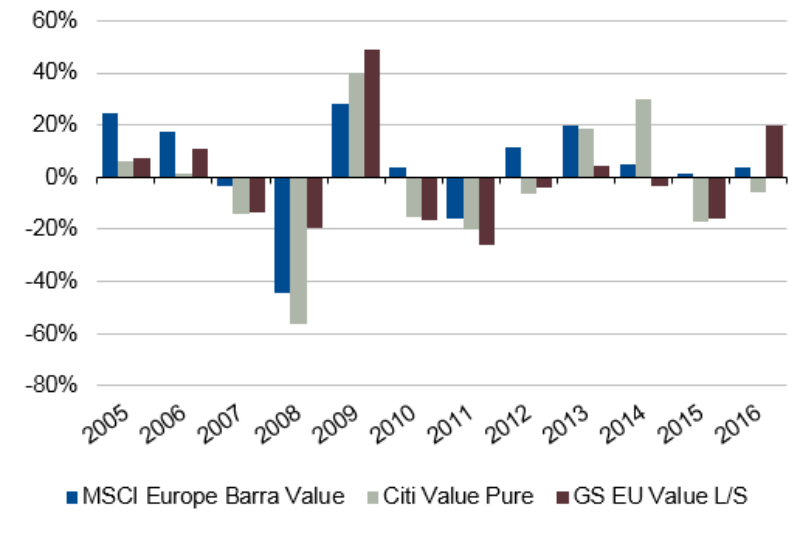
However when we examine the performance of seemingly similar strategies that have a common risk factor label we observe returns that are distinctly different. This is illustrated in figure 4, which shows the performance of market neutral value strategies investing in a universe of European stocks. All three are essentially trying to achieve the same objective; that is to devise a set of rules that create a portfolio which buys undervalued stocks whilst selling short expensive ones in order to systematically capture the convergence between the two.
The returns have been normalised for volatility to make them more comparable and it is immediately apparent that despite the common naming convention the outcomes are far from normalised. Indeed they look more like a group of ‘active’ strategies investing in unique styles rather than offering the desired clustering properties of a core ‘beta’ for the Value risk factor in Europe.In the universe of alternative strategies a framework of categorising investment styles has emerged that is summarised in figure 3.
Figure 3. Alternative risk factors
As we examine the returns of more strategies grouped by their risk factor style, the more we see a similar broad spectrum of realised returns making the classification system of Alternative Beta seem imprecise. So what can explain these observations and can we hope to make a case for such products having understandable beta sensitivities to agreed benchmark definitions at all?
To investigate the feasibility of defining a benchmark for alternative factor strategies, let us consider the choices that we are confronted by in their construction. I have split them into three types – parameters, conditioning and execution.
Figure 4. Annual Performance of Value risk premia1
1. PARAMETERS
The principles by which a strategy will trade can be defined in a set of parameters. Here is an outline of some of the basic choices:
The investment universe – setting out the list of instruments by asset type, geography, sector, size and liquidity where the particular risk premium is most applicable.
The metric that represents the risk factor – there are many different ways in which investors think about valuation of stocks, for example. At time of writing, if you were to assess the S&P 500 by P/E, P/B and P/FCF2, for example, you would get three different answers as to which stock is the most undervalued (Arconic, Transocean and Prudential respectively3).
Lookback periods for time series factors – for a momentum strategy, for instance, are we more interested in a trend over a month (a ‘faster’ signal) or a year (a ‘slower’ signal).
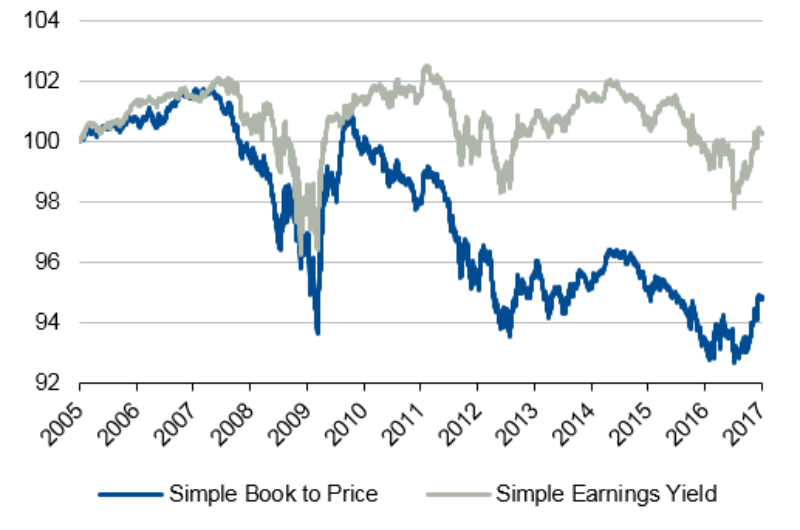
The potential impact on returns associated with these parameter choices is highlighted in figure 5. Here we again examine the European value strategy but compare the results from using two different valuation metrics: book to price and earnings yield. One can see that even changing one parameter can lead to a substantially different return path, but another more alarming observation is also shown. If you had run this analysis in late 2009 you might have thought that there was not much difference between the two definitions of value. Fast forward and you would have been a dissatisfied investor had you chosen B/P as your preferred metric.
Figure 5. Two interpretations of European Value – simulated performance since 2005
2. Conditioning
We believe the second set of choices in designing a successful strategy revolves around conditioning. This relates to any rules built into the portfolio which nuance the principles applied by the parameters. Examples include risk management techniques such as volatility scaling and portfolio construction, different methods of weighting constituents based on their factor signals, or introducing secondary signals (e.g. augmenting value signals with a price momentum element).
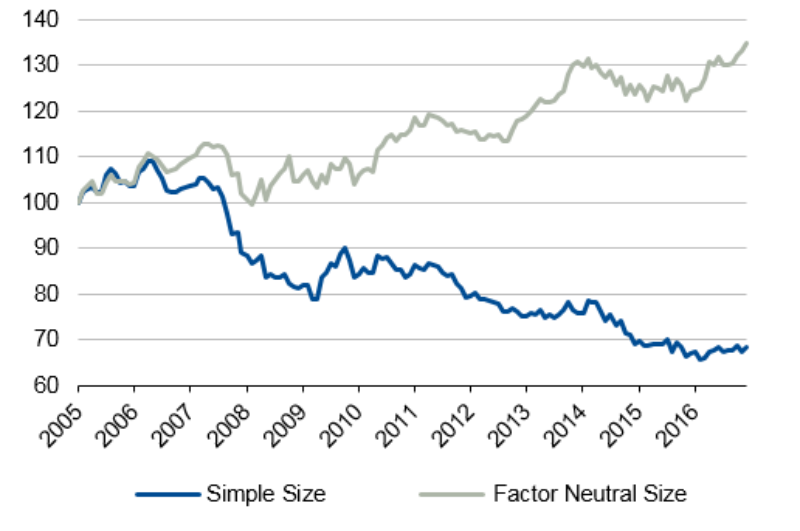
The varied impact of conditioning can be seen in figure 6. This shows two methods seeking to capture the size risk premium – that is the premium paid for taking the risk of owning small cap stocks, relative to the wider market.
The Simple Size model ranks a global stock universe by their market capitalisation and buys equal weights of the smallest 20% of stocks, selling short the largest 20%. The minimalism of this method means that there will be all sorts of other biases affecting the performance such as sector and country tilts. The Factor Neutral Size model uses a ranked scoring method for size, but then determines the long and short stock exposures through a country, sector and factor neutralising portfolio construction technique, leaving the purest possible portfolio exposure to the size risk premium.
CFA textbooks, Fama/French and the pantheon of mainstream financial academics will tell you that there is a premium for investing in smaller market capitalisation stocks. Interestingly, however,
figure 6 shows us that a naive method of portfolio construction may be deficient in delivering the expected returns.
But here arises a further complication: advanced financial and statistical knowledge is required to implement the necessary conditioning and this knowledge can easily spill over into hubris. In other words, with so many available conditioning tools, there is a temptation to get too clever, to fiddle with more and more buttons on the control panel. Degrees of freedom are a double-edged sword: on the one hand they allow for precise exposures to be expressed, but on the other, their increase leads to data mining, over-fitting and poor out of sample performance. A balance must be found.
Figure 6. Simulated portfolios capturing Size risk premium with varied conditioning
3. Execution
Finally, constructing an investible portfolio strategy requires decisions around execution. On an explicit basis this requires striking the balance between purity of signal and the cost of turnover. Market moves can happen very quickly. The parameters and conditioning of the portfolio may be well tuned, but this can quickly degrade if the regularity of rebalancing is too sporadic. On the other hand, if turnover is too frequent this will result in spiralling transaction costs which can itself interfere with the realised returns.
Conclusion
Imprecision of definition makes benchmarking difficult. It is easy to define the S&P 500 as the 500 largest stocks by market capitalisation and create both a benchmark return and a portfolio to match that performance. Given the range of choices outlined above, the analogous challenge for risk factor strategies is clearly much more complex making any benchmark for Alternative Beta nebulous at best. In short, Alternative Beta products cannot be considered in the same way as Traditional Beta. Finding a path through the myriad of choices to create an investable alternative factor strategy requires a degree of skill that is often associated with alpha generation.
However, we believe there are some investment product properties that the word ‘beta’ should automatically bring to mind. It should imply higher liquidity, larger capacity and operational efficiency which in turn should also imply a lower fee than a fully-fledged alpha seeking product. All these properties are achieveable in practice for alternative strategies, so we would propose to amend the schematic shown in figure 1, to that illustrated below in figure 7. What some see as Alternative Beta, we view as a cheaper, larger scale, more liquid, alternative alpha.
Figure 7. Alternative Beta is Liquid Alternative Alpha
Footnotes
1. Source: MSCI, Citi and Goldman Sachs.
2. Price to earning, price to book and price to free cash flow respectively.
3. Source: Bloomberg, as at February 2017.
Important Information
The information in this material is for illustration and discussion purposes only. It is not intended to be, nor should it be construed or used as, investment, tax or legal advice, any recommendation or opinion regarding the appropriateness or suitability of any investment(s) or strategy/strategies, or an offer to sell, or a solicitation of an offer to buy, an interest in any security, including an interest in any private funds or pools, or any other investment product(s), managed account(s) or other investment vehicle(s).
Any opinions, assumptions, assessments, statements or the like (collectively, “Statements”) which are forward-looking, with regards to the market constitute only subjective views, beliefs, outlooks, estimations or intentions of (The Manager), and are subject to change due to a variety of factors, including fluctuating market conditions and economic factors. Future events and actual results (including actual composition and investment characteristics of a portfolio) could differ materially from those set forth in, contemplated by, or underlying these Statements, which are subject to change without notice. In light of these risks and uncertainties, there can be no assurance and no representation is given that these Statements are now, or will prove to be accurate, or complete in any way. Man Group undertakes no responsibility or obligation to revise or update such Statements. Statements expressed herein may not necessarily be shared by all personnel of (The Manager) and its affiliates.
Unless stated otherwise the source of all market data is Man Group database and Bloomberg.
Financial indices are shown for illustrative purposes only and are provided for the purpose of making general market data available as a point of reference. An index is a statistical measure that shows changes in the economy or financial markets and may serve as a benchmark against which economic and financial performance of an investment is measured. An index is not available for direct investment, and its performance does not reflect the expenses associated with the management of an actual portfolio. The Fund’s/Strategy’s investments are not restricted to the instruments composing any one index. Certain information is based on data provided by third-party sources and, although believed to be reliable, has not been independently verified and its accuracy or completeness cannot be guaranteed.
All investments involve risks including the potential for loss of principal. Alternative strategies involve magnified risks, are speculative, are not suitable for all clients, and intended for experienced and sophisticated investors who are willing to bear the high economic risks of the investment. Past performance of an investment strategy does not guarantee similar future results.