
Worldwide mobility explosion and implications for financial markets
By Irina Krasnyanskaya; Jens Robatzek, Kroll
Published: 20 November 2023
A new economic reality with high interest rates, high inflation and high asset price volatility is leading investors to desire more access to private investment products. As a result, certain limited partner investment structures are requiring more frequent and more timely valuations than the historical quarterly valuation paradigm. More frequent fair value estimates provide access to capital that would otherwise not be available. Investors can choose to move in or out of such vehicles when significant market movements occur, and more timely data allows for timely portfolio rebalancing and hedging. Outside of the macroeconomic changes, the world has been evolving with dramatic changes in the world of connectivity, which has and will continue to have greater impact on financial markets.
In this article, we will analyse both traditional economic indicators as well as alternative non-traditional data, including global mobility indicators—which also impact financial markets—and private equity investments. We will assess the impact on asset prices and how to practically incorporate the changes associated with macro- and sector-driven parameters on valuation of funds with portfolios of private equity investments as an example.
A new reality
In the past, the world was not as connected geographically, and events in one location only had a local effect. As such, investing in different geographies provided natural diversification. Is it still the case today? Not exactly.
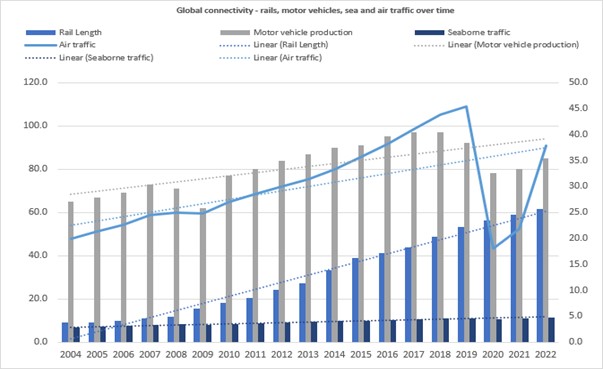
A boom in connectivity and global mobility in the last 20 years reduced natural diversification. This can be observed by several metrics l, including the number of passengers boarding planes each year, the development of high-speed trains (500% up from 2010 levels1 and doubling since 2050), the worldwide motor vehicle production (up 30% from 2000 to 20222) and the greater distances covered by railroads. See Figure 1 below for more details.
Figure 1 – Global mobility trends: Rail, motor vehicle and sea traffic
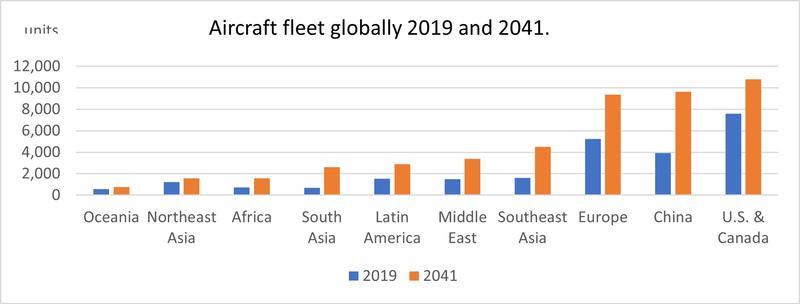
Similarly, as shown in Figure 2, global aircraft demand is expected to grow further by 40% in the next ten years.3
Figure 2 - Size of aircraft fleets in 2019 vs. 2041
The impact of greater mobility
With lower geographic diversification and higher interconnectivity, markets are moving faster, and it is becoming more and more important for all investments (including private and infrequently traded instruments) to be valued on a more frequent basis. The common cadence of quarterly or semi-annual valuation limits an investor’s ability to hedge/rebalance timely enter/exit positions in a response to market movements and exposes funds to potentially significant financial losses.
As the need for more frequent valuations becomes evident, how would this work for illiquid private markets and associated reporting of fair value?
The link between private markets, major economic indicators and public markets
There have been discussions in the industry about the so-called denominator effect,4 which is when public market valuations move significantly, and private markets do not. These markets rarely move in-sync due to the impact of company-specific esoteric factors and since private markets tend to be less volatile. Nonetheless, private markets indeed follow the public markets and changes in macroeconomic indicators directionally, but with a lag.
We performed a regression analysis from Q3 2007 to Q3 2023 using daily observations of Foreign Exchange (FX) rates, interest rates, commodities, main equity indexes and to analyse movements in the private market (as evidenced by the valuation of companies with major exposure to private markets) and major economic indicators. We found that public markets provide a good fit in terms of directional movement, though not necessarily for the degree of magnitude.
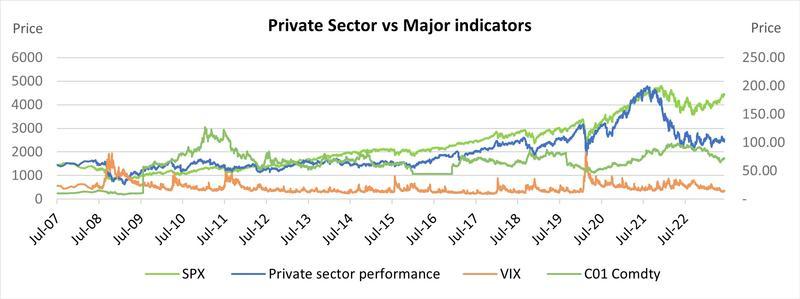
As shown in Figure 3 below, private sector performance is highly correlated with the public market, but with a two to three-month lag. Private market performance has been negatively correlated with volatility, interest rates, inflation and oil prices and positively correlated with the equity markets.
Figure 3 - Private sector moves in synch with major indicators
We also looked at the private market performance as represented by the private sector transaction multiples since 2007. Using the technology sector as example, we can see that EV/revenue multiples for private companies in the financial sector moved in synch with the public markets, i.e., Nasdaq.
Figure 4: Private technology sector revenue multiples vs. Nasdaq
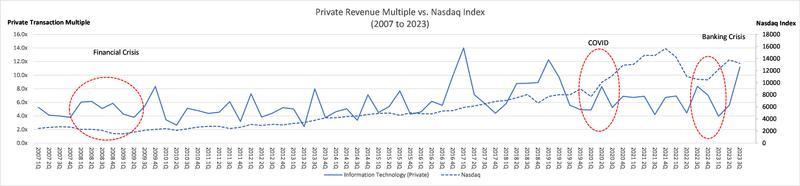
We can see from Figure 4 above that major market dislocations (in both private and public markets) were linked to major world events.
Implications of mobility for financial markets
Apart from geopolitical factors, the latest and greatest shocks to financial markets were a result of the COVID-19 pandemic followed by the collapse of Silicon Valley Bank and the US banking crisis. However, these were not an isolated events as pandemics and recessions have been recurring.
World pandemics and recessions
Tremendous developments in global connectivity have made the spread and impact of pandemics and recessions faster and more global. While we note that pandemics and recessions have occurred throughout history—including three plagues, seven cholera pandemics, variety of flus, COVID-19 and four global recessions—the frequency of pandemics and recessions occurring globally could be linked with the increase in global connectivity. Therefore, considering the pace of mobility development may indicate an exposure to future market volatility. The next pandemic or local financial crisis could potentially spread from one isolated location to another as goods and people transfer faster and have a wider impact.
Overall, given the increased global mobility and the potentially faster spreading of pandemics and market volatility, tracking factors/indicators beyond traditional valuation inputs is becoming more crucial.
From quarterly to monthly and daily valuation
Marking investments daily has been a requirement and is already frequent practice for the sell−side market,5 but now some of the investors on the buy-side6 are interested in more frequent valuation.
However, how can this realistically be achieved when, in practice, the net asset value (NAV) for underlying portfolios are only available quarterly and with a time-lag?
As Partner Capital Account Statements (PCAPs) are provided on a quarterly basis, the reported NAV is used as the starting point for estimating the value of a fund interest at each subsequent monthly or daily valuation date. Afterward, adjustments for capital calls, distributions and the estimated changes in the fair value of underlying investments will be made. While for actively traded investments, the change in the fair value will be determined through the following: market price, a market adjustment factor based on a benchmark that is considered to be most representative of the portfolio (i.e., an index basket according to industry/size/rating) and a correlation coefficient, which will be estimated and utilised for the non-frequently traded investments to evolve the last reported NAV accordingly. Additionally, changes in cash and company-specific esoteric factors are considered.
The choice of indexes can be substantiated through back testing of the portfolio performance (through historical NAV statements) versus the movement in the publicly available benchmarks and index baskets. However, the results would be as robust as the starting NAV statements and additional deep dive analysis would be required on a periodic basis for private equity positions that require professional judgement. In addition, back testing review should be performed to redial the model.
And while the regression captures market factors, judgment needs to be applied concerning which idiosyncratic factors are relevant and how large of an impact they have. PCAP statements provide periodic feedback and indicate if adjustments are necessary.
While this process involves multiple steps, it allows the investment vehicle to provide fair value estimates to investors on a timelier and more frequent basis. Overall, it provides an advantage of being able to respond to world events and rebalance the portfolio much faster.
Summary
Global connectivity and mobility have caused our world to evolve, resulting in potentially more fluid/volatile prices across asset classes, including less frequently traded securities such as private equity. The next market shock or pandemic could now have a much greater affect as goods and people can move across greater distancer faster than ever, potentially impacting cross dependency and connectivity of asset prices. Overall, this new world with greater world connectivity could pose more challenges for companies that do aspire to have more frequent valuation.
Updating the valuation for private equity securities is a combination of complex modelling coupled with qualitative analysis. Granted there would always be a large component of company-specific factors in private assets that requires professional judgement, the macro- and industry-specific factors could be considered more frequently. Most importantly, up-to-date valuation estimates provide a greater understanding of the portfolio and allow for more informed decision-making.
1. Source: International Union of Railways & IEA
2. Source: Statista.com
3. Source: www.oliverwyman.com - https://www.oliverwyman.com/our-expertise/insights/2017/jun/paris-air-show/global-commercial-aircraft-fleet-to-grow-to-more-than-35000.html
4. The denominator effect occurs when the value of one part of a portfolio decreases substantially and decreases the overall value of the portfolio so that any parts of the portfolio that did not decrease in value now represent a larger portion of the overall pie. Source: www.benchmarkcorporate.com
5. The sell-side focuses on the creation, promotion, and sale of stocks, bonds, foreign exchange. (Source: Investopedia)
6. The buy-side refers to firms that purchase securities. (Source: Corporate Finance Institute)