
Trend-following: A different point of skew
By Graham Robertson; Rupert Goodall, Man AHL
Published: 18 September 2023
In Trend-Following: What’s Not To Like?, we observed that trend-following performs as well as equities in the long term, is lowly correlated, has better risk-management properties, and generally works well when equities don’t. In other words, trend-following and equities get you to the same place in the long term, but take different routes to get there. In this article, we examine the different characteristics of these routes in two ways; first, in terms of the distribution of returns; and second, how sudden market reversals and losses for trend-following strategies – such as those observed in March 2023 around the Silicon Valley Bank (SVB) crisis – fit into the narrative.
Trend-following: A different point of skew
Figure 1 below depicts the distribution of returns of trend-following strategies and equities. We use the SG Trend Index, which comprises returns from 10 trend-following managers and for which we have daily data since 2000, and MSCI World equities.
Figure 1. The distribution of returns of world stocks and trend-following over different time periods
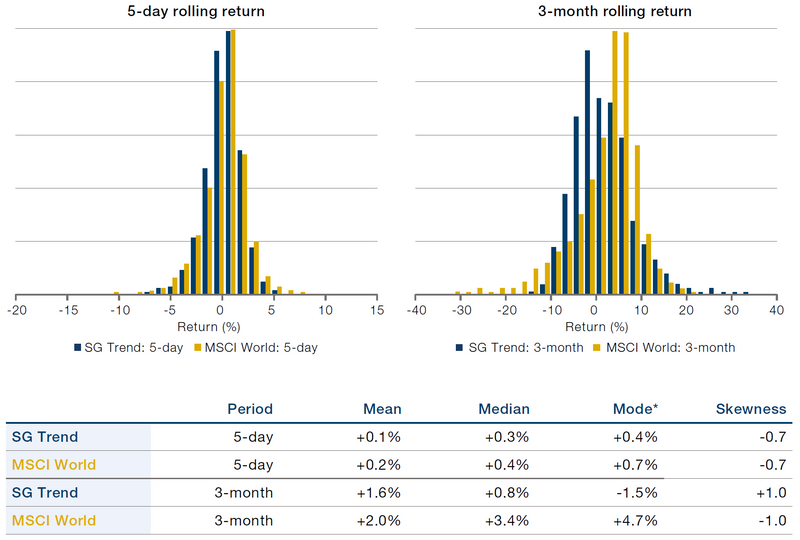
*Mode is an estimation based on the peak of the probability density function (PDF) of the distribution, which is approximated using a Gaussian kernel density estimator (KDE) .
Past performance does not guarantee future results.
The financial instruments mentioned are for reference purposes only. The content of this material should not be construed as a recommendation for their purchase or sale.
The charts above illustrate that on a weekly basis:
- The returns of trend-following strategies have similar characteristics to stocks;
- Returns peaks are similar, with a visibly fat and long left tail.
A time horizon of one week is much smaller than the trend-sensitivity of trend-following strategies, which span 2-6 months to our knowledge. As a result, over this timeframe, a trend-following strategy does not have enough time to react significantly to changes in markets.
As a point of comparison, we choose a 3-month window which should allow ample time for a trend-following strategy to react to changing market conditions. This time period also has the benefit of aligning with the quarterly rebalancing cycle typically followed by investors in the manager selection and allocation process. Over this longer horizon, we observe quite different characteristics:
- Large losses from equity strategies are much more frequent than those from trend-following. The left tail of the equities distribution, in yellow, is significantly larger than that of trend-following;
- Large positive trend-following returns are more prevalent than in equity markets. The right-tail of the trend-following distribution is larger than that of equities;
- The most frequently observed 3-month return in equities is larger than that of trend-following. However, the mean 3-month returns are similar.
Of course, we are just describing skewness. Over a long enough timeframe, trend-following returns are positively skewed, while equity returns are negatively skewed. With trend-following, mean > median > mode, while for equities it is the other way around.
Unlike the case for weekly returns, the intuition behind a positively skewed distribution for trend-following returns over a 3-month horizon is that trend-followers have time to react. Profits are run as a trend develops. Positions are quickly cut as the strategy shuts itself down when a trend reverses and losses are experienced. We can examine this more detail by considering performance of trend-following strategies around the SVB crisis earlier this year.
Case study: SVB crisis
Kahneman and Tversky (1979) point out that it is human nature to experience more pain from a loss than pleasure from a gain. Only natural, then, that we focus on the left tail of our distribution in a little more detail. We use the market events surrounding the collapse of SVB and the contagion to Credit Suisse as a case study.
The SVB news caused an initial flight-to-quality effect. Risk assets fell – world stocks dropped 3.6% between the 8 and 13 March. However, the immediate move was in short-dated fixed income: on 9 March, US 2-year Treasury bond yields fell the most on in more than 30 years. By the end of the month, however, stocks had regained their poise and finished 2.6% higher.
Indeed, by the end of the first quarter, equities were up 7.7% on the year.1
Multi-asset investors, including classic 60/40 and risk parity portfolios, were largely oblivious to this turmoil. What was lost in equities was broadly made up for in bonds. Trend-following strategies, on the other hand, were hit hard. The market moves around SVB were counter to the prevailing trend. Equities had been rising and bonds falling, so trend-following strategies were long equities and short bonds, and therefore positioned precisely the wrong way for a flight-to-quality event.
We’ve previously spoken about how trend-following’s losses in the week or so following SVB were on a par with the worst episodes for trend-following.2 Figure 2 shows the five worst weekly returns for the SG Trend Index post 2000, aligned at the start of the loss, and showing performance in the 12 months both before and after. The findings can be summarised as follows:
- By definition, reversals happen at the end of a trend;
- Trend-followers incur losses at this point (if you don’t, you’re not a trend follower);
- Trend-followers generally lose less in the reversal than they make in the preceding trend;
- Losses around the reversal are contained, because the reversal leads the strategy to shut its positions down;
- Trends typically re-emerge after the reversal, and trend-following strategies make up for losses within six to 12 months.
Figure 2. Trend-following returns 12 months pre- and post-reversal
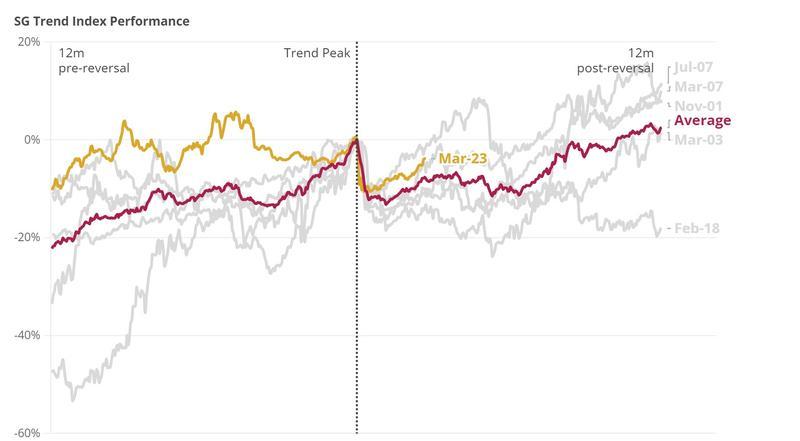
At the time of writing, it appears that the performance of the SG Trend Index post SVB is playing out somewhat according to the historic script (as illustrated by the yellow line in Figure 2, above).
Sudden market shocks like those around SVB often bring into question trend-following’s ‘crisis alpha’ credentials: its convexity profile or skewness. Aren’t trend-following strategies supposed to protect on the downside, and have larger positive returns than negative? As we discussed in the previous section, the answer lies in the period over which we want protection. In short, when the duration of a market move is measured in days – a shock event like SVB – the profitability of a trend-follower is a lot like the toss of a coin. A trend-follower could be positioned correctly or incorrectly.
The strategy has little time to react, and the distribution of returns can be quite left-tailed, as per Figure 1. When market moves are sustained, however, lasting weeks to months, then this is more consistent with the duration of trends and the strategy’s positions have time to react accordingly.
What we see in Figure 2 is a good example of how, consistent over time, trend-following strategies are able to cut off that left tail by shutting down positions and going into wait-and-see mode. If the selloff continues, trend-following strategies are potentially able to migrate to short beta positions and turn losses into gains. If the selloff does not materialise, the trend-following strategy may resume its old positions. In contrast, without intervention, a long equities position will continue to generate losses if the environment continues to deteriorate.
Improving skewness
Intuitively, we can improve a trend-following strategy’s responsiveness to a crisis by trading faster, by looking for shorter-length trends. We investigated this in “The Need for Speed in Trend-Following” and found that increasing trend responsiveness, or ‘speed’, did indeed improve skewness albeit at the expense of longer-term returns. Nevertheless, if the goal of allocating to a trend-following strategy is to sit alongside a beta portfolio for ‘insurance’, then a faster implementation is potentially better. In simple terms, a faster trend-follower can cut losing positions quickly, or even turn short quickly in the event of a crisis.
Drawdowns are another way of making the same point. Figure 1 tells us that there is a much higher probability of a large loss for an equity strategy relative to a trend-following strategy on a 3-month basis. Depending on how these losses follow each other, larger drawdowns might be expected from equities relative to trend-following. Indeed, trend-following strategies perform almost as well as equities in the long term, yet their drawdown is one-third that of equities (which have lost half their value not once, but twice, since the turn of the century; see “Trend-Following: What’s Not to Like”).
Conclusion
We have concentrated on the comparison between trend-following strategies and equities in this article. Indeed, it is our experience that this is the way investors look at it as well. But trend-following isn’t just about equities. As we showed in “The Need for Speed in Trend-Following Strategies”, trend-following’s crisis alpha properties originate from all asset classes, not just equities.
The SVB crisis (and history) show that losses experienced by trend-following strategies during reversals are well constrained. This is because the strategy shuts itself down whenever it experiences losses; trend-following is an inherently risk-managed strategy. A change in the trend – often accompanied by a rise in volatility – means that positions are naturally cut, losses are truncated, drawdowns are reduced and the strategy prepares for whatever trends subsequently emerge.
Bibliography
- Mackic, A. (2023), “The Need for Speed in Trend-Following Strategies”, Man Institute, Available at: https://www.man.com/maninstitute/need-for-speed-trend-following
- Goodall, R., and L. Kissko (2023), “Trend-following: Rolling with the punches”, Man Institute, Available at: https://www.man.com/maninstitute/trend-following-rolling-with-punches
- Robertson, G. (2023), “Trend-Following: What’s Not to Like?”, Man Institute, Available at: https://www.man.com/maninstitute/trend-following-what-not-to-like
- Kahneman, D., & Tversky, A. (1979). “Prospect theory: An analysis of decision under risk”. Econometrica, 47, 263-291.
- Icil molorio recuptas sectia eument.
- Ur rat voloratur autetur, ab ipit, qui nos doluptia quuntiundam unt eos re sam veligen iatempo ritature, tecestem vel il eum harum aspe nus ma qui alitiun totaquam ius eic tem ipsam, volor ma plaboribus exceatiis antia que nonse perum nossum id et autem harum aut duciet eum hit de dolupturios veliae nemporest deruptatius.
- Esecaest, omnis ent minture repella boreseque landani sitat volorio illes id quia sunt, test volo delentiunt, tenda alic te voluptatiur, consequ untiae necusa namet
1 Source: Bloomberg
2 Measured by more than two decades of daily data available for the SG Trend Index, which represents 10 trend-following managers.