Lessons from the 1970s
By Henry Neville, Man Group
Published: 20 March 2023
Those who cannot remember the past are condemned to repeat it. Credited to George Santayana. But could have been Rene Magritte or Winston Churchill. Google isn’t quite sure. In any event, it’s a wise old saw, and one which today’s central bankers and investors would do well to keep in mind.
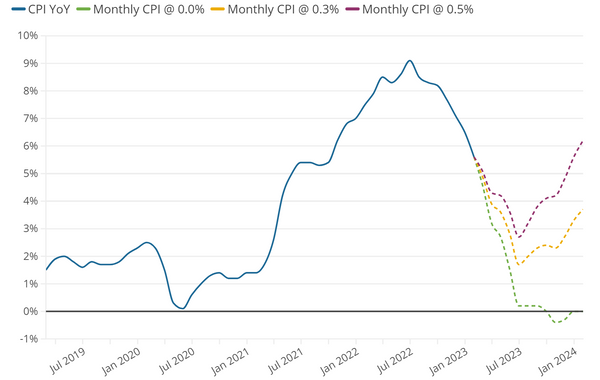
Headline inflation in the US has fallen by 260 basis points in six months, from 9.1% to 6.5%.1 Our models suggest it will continue downward. Fast. To reach 2% this year. By-the-by, we don’t even see that as a particularly bold prediction. The past six month-on-month readings of the non-seasonally adjusted headline CPI basket have averaged at…0.0%.2 Unless future monthly readings move abruptly higher, the power of the base effect will do a lot of heavy lifting. Figure 1 shows three pathways for year-on-year (YoY) inflation based on different monthly increases. At current rates we will have outright DEFLATION on a YoY basis in 2023.
Figure 1. US inflation pathways based on different monthly readings
To be sure, we view this as unlikely, and a two-point-something trough is our base case. But still, with expectations continuing to run above this (Wall Street’s average 12-month ahead estimate is 3.6%, with a low of 2.5% and high of 7.4%3), we think many market participants, from Cathie Wood to Jay Powell, will be left with the warm fuzzy feeling of disinflation, the recent monster non-farm payroll print notwithstanding.
But inflation is like the Terminator chasing Sarah Connor. Until it’s completely destroyed – in the hydraulic press or the lake of molten steel (the various sequels merge into one) – it will keep coming back. This was the experience of the succession of Federal Reserve chairs in the 1970s.
In Figure 2 we show YoY inflation, the Fed Funds Rate and Taylor Rule implied rate for the three inflationary waves between 1967 and 1982. In the centre of the graph, we annotate with the tenures of the various Fed chairs through this time.
Figure 2. Inflation and interest rates in the 1970s
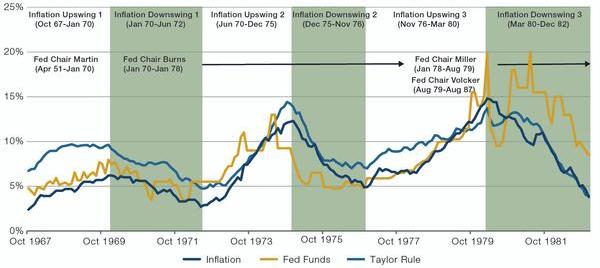
Two things jump out to us. First, monetary policymakers clearly responded to the inflationary waves as they rose. Arguably their responses were much more impressive than their successors today. Indeed, from the chart it looks like the reputation of good old Arthur Burns, now the financial hack’s go-to analogue for feckless central banker, has been unfairly traduced.
On his watch, inflation rose from 3% to 12%. But one can reasonably argue that he put his shoulder manfully to the wheel in response, keeping real rates positive for almost the entire period, and by an average of +1%. During the most recent inflationary surge, when headline CPI YoY went from 2% to 9% between February 2021 and June 2022, the current administration, with all the boldness of brave brave Sir Robin, took rates from 0.25 to 1.75%4. Over that period, real rates were negative all the time and on average -6%. So, while the past six months have seen some impressively hawkish sounding noises, it is dust on the scales given what has come before.
The second thing we observe from Figure 2 is that it wasn’t until rates were taken meaningfully and persistently above the Taylor Rule (as we have previously discussed in The Forgotten Rule) that the inflationary sequels stopped. Again, to be fair to Chairman Burns, he did move rates above this threshold. At one point, the Fed Funds Rate was 11% while the Taylor Rule would have implied just 7.5%. But ultimately, he was too easily cowed by President Nixon and retreated before the job was done. It wasn’t until Volcker, who took rates to 20%, some six points higher than the Taylor Rule, and proceeded to keep them above inflation until his retirement in 1987, that the WIN could be declared.
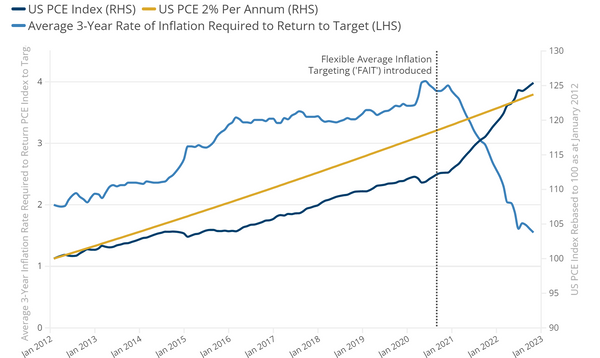
Of course, the Taylor Rule was not formulated until 1993, so it cannot have been being discussed explicitly in the 1970s. But we think it would have been there implicitly in a number of ways, not least of which the fact that the rule takes account of realised inflation. That is, if you have 9% inflation in year one and 2% in year two, some might see this as job done, but for most actual people, they’ve just seen their bills go up by 9% and the fact that they’re now ‘only’ going up by 2% is scant consolation. It should be noted that the Fed itself implicitly made this point by explicitly incorporating the reverse into its Flexible Average Inflation Targeting (FAIT) framework in August 2020.
The idea then was that, per Figure 3, the actual personal consumption expenditure (PCE) index since the Fed first adopted a 2% inflation target was close to 5.5% below where it would have been if that target had actually been met. Thus, to return the index to target would require inflation to run at around double the objective over three years. And the Fed would take this ‘memory’ of inflation into account when setting policy rates. Not much has been heard of FAIT since then. Perhaps coincidentally, it suggests policy will now need to be tightened such that inflation is 50bps below the 2% target.
This is no time to go wobbly, as a wise woman once said. And what was true of the Gulf in 1990 could equally be applied to US monetary policy in 2023. To really end the inflationary waves here and now, to cast the ring into Mount Doom as it were, rates would need to peak, not at the 5% where market pricing is at present, but closer to 9% as is today implied by the Taylor Rule. Clearly, the Fed can’t realistically do that. The impact on housing alone would simply be too painful and too politically unpalatable. Like Isildur we expect them to turn back, and understandably so. But for investors this does mean that the inflationary surge of 2021-22 is unlikely to be the last of this decade.
Figure 3. Implied rate of inflation required to return the Fed to its long-run target
The other lesson of the 1970s is that even though high inflation decades are, overall, not good times to hold equity risk, the periods in between the waves can be very strong. Returning to Figure 2 (above), while over the full time period US equities returned -0.5% in real annualised terms, the corresponding figures for the three inflation downswings (the green shaded areas) were, respectively, +7%, +18% and +15%.5 At the start of the year, we wrote a piece entitled It’s All Going To Be Okay, making this same point, that a period of disinflation is generally a time when the market rallies. And this continues to be our view for 2023. Despite the fact that earnings forecasts have been revised down by close to 2% year to date, the S&P 500 Index has rallied by nearly 8%. 6
The market can only focus on one thing at a time, and currently that thing is inflation. So, we continue to see the next couple of quarters as being risk-positive and expect stocks to continue to climb the wall of worry.
But towards the end of the year and into 2024 we expect the inadequacy of the Fed’s response to be revealed, and the 2020s’ second wave of inflation to be initiated. This is going to be a turbulent decade for investors.
Buckle up.
1 Source: US Bureau of Labor Statistics; as of 12 January 2023
2 Source: US Bureau of Labor Statistics; as of 12 January 2023
3 Source: Bloomberg; as of 6 February 2023
4 Source: Bloomberg; as of 6 February 2023
5 Source: Man DNA; as of 6 February 2023
6 Source: Bloomberg; as of 6 February 2023