
Alternative mutual funds: Growth potential looks solid coming out of the gate
By Paul Holden, CIBC Capital Markets
Published: 27 September 2019
The Canadian alternative mutual fund market is less than a year old and there are already 16 companies participating with a total of 42 funds on the shelf. Total AUM stands at $3.6B and we think the right ingredients are in place for alternatives to grow into a meaningful share of the $1.5T mutual fund market. The introduction of alternative mutual funds is good news for the industry and we believe the product will also benefit investors over time.
We believe that most of the right ingredients are in place for the market to grow rapidly in the coming years: i) there is broad fund sponsorship, including many of the largest fund companies in Canada that have vertically integrated business models; ii) the vast majority of funds are widely accessible with low minimum investment thresholds; iii) investors have a broad selection of product from which to choose, including a wide variety of investment strategies and fee structures; iv) some alternative funds have already been included into managed solutions (~21% of AUM is help by other funds); and v) performance to date, albeit over a short time frame, demonstrates that the funds are delivering the low volatility returns they are designed to achieve.
Risk Ratings Are A Good News/Bad News Story
One of the most common questions asked by investment companies prior to the launch of alternative mutual funds was how they would be treated from a risk rating perspective. There was a concern that the risk rating might unduly punish strategies that used more sophisticated investment strategies, such as shorting and derivatives, even if the intention of such strategies was to reduce return volatility. There are two sources of risk ratings – the one assigned by the fund manufacturer and the one assigned by the dealer (i.e. advisory and financial planning companies).
The risk rating assigned by the fund is fully transparent and appears on regulatory filings. The good news is that the vast majority of the AUM and funds (24 of 42) are rated low to medium (comparable to a balanced fund or corporate fixed income fund), which we view as a positive outcome as it speaks to the risk mitigating potential of alternative mutual funds. 13 funds have a medium risk rating (comparable to a large cap equity portfolio), 3 are rated low risk (comparable to a money market or low risk fixed income fund) and only 2 are rated medium to high (equivalent to an equity fund that is concentrated in a specific sector or region).
The risk ratings from dealers are less transparent. In some cases the dealers may just use the rating from the fund company, but in many cases the dealer will assign their own rating. Our understanding is that many dealers have assigned a medium risk rating to strategies with a historical track record (depending of course on the track record) and a high risk rating to strategies with no track record. The challenge is that many of the alternative mutual funds launched to date do not have a 3-year return history and hence, have been assigned a high risk rating regardless of the actual underlying investment mandate.
A Closer Look At Fund Structure
There were a number of questions that industry participants had around fund structure and competitor intentions before regulations were finalized. Questions included types of mandates, the use of sub-advisors, fee structure and others. We siphoned through fund prospectuses and now have specific data points on which to base answers for these questions.
We categorized the universe of funds into two broad investment objectives: i) absolute return (positive returns regardless of market conditions); and ii) alpha type strategies where the intention is to outperform a benchmark over time on either an absolute or risk-adjusted return basis. We find that alpha type strategies are more common, which is perhaps a function of regulatory restrictions around shorting (maximum of 50% of gross value).
In terms of asset classes, the most common is equity funds followed by multi-asset class. In most, but not all, cases the equity funds have an alpha generating investment objective. The multi-asset class tend to have an absolute return objective. We are somewhat surprised by the small number of funds that are focused on fixed income strategies. It would seem like there is strong demand for yield enhancing product given low yields and demographic needs.
The majority of funds have a performance fee (30 of 42 funds). The performance fee is typically 15% or 20% with a couple of fixed income mandates using a 10% performance fee.
Product has generally been designed to be widely accessible to investors. A minimum initial investment of only $500 is required for more than half the funds. Effectively all the funds offer daily redemption rights with minimum hold periods no different than traditional mutual funds. Also the funds are offered in multiple series (A, F, I, etc) with pre-authorized purchase plan and systematic withdrawal plans to fit investor needs. Effectively the liquidity and accessibility looks very similar to traditional mutual funds, as intended.
Exhibit 1. Management Fees (Series F)
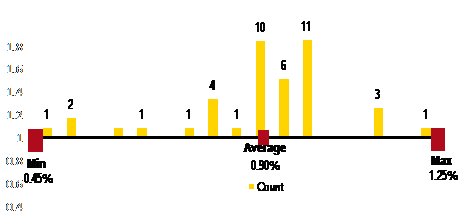
Drilling Down On Fee Structure
Fees were a key discussion point as investment firms contemplated alternative mutual fund offerings. The average base management fee on a series-F fund (no trailer fee) is 0.91%. Funds are clustered around the 0.9%-1.0% range. That is around where we would see most new equity fund product priced.
We count a total of 13 funds that use a traditional hedge fund performance fee structure – the fund earns a performance fee based on positive returns over a perpetual high water mark.
There are also a good proportion of funds (10) that use relative benchmarks. Common benchmarks include the S&P/TSX Composite Total Return Index and FTSE Canada government bond indexes. These funds also follow a perpetual high water market methodology, which provides an incentive to outperform long only benchmarks consistently from year to year (shortfalls in any year have to be recovered in subsequent years before performance fees are earned).
The other performance fee structure we see is fixed hurdle rates, but it is far less common with only 5 funds using a fixed hurdle. The range of annual return hurdles is 2%-6%.
How Is Performance To Date?
We think it’s worth looking at fund performance, even with very short track records, to see if alternative mutual funds are doing what they are intended to do. After all, performance will be one of the primary drivers of future demand. We have used daily NAVs for funds that were created before January 1, 2019 to calculate both YTD returns and the daily standard deviation of returns.
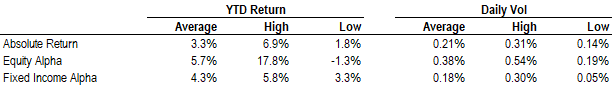
Absolute return funds are generating the types of returns that we would view as attractive. The average return is on pace to hit an annualized rate in the 6-8% range, a normalized equity return like outcome, and the funds are doing that with volatility that looks more like a bond index than an equity index. The range of fund returns and volatility suggests there is no excessive risk taking.
Performance from funds that we have categorized as equity alpha funds are also encouraging. The funds are generally designed to have a long bias (positive beta), but with less volatility than the market. Hence, we should not expect the average return to match equity indexes in a year when the S&P/TSX Composite Total Return Index is up 13% YTD and the S&P 500 Index (CAD) is up 15% YTD. But, we should expect return volatility, which we measure as the standard deviation of daily returns, to be lower than equity indexes. This is exactly what we find with the YTD results. We think relative returns could look better for equity alpha funds in a sideways or down market.
The conclusions for fixed income alpha funds are similar to the equity alpha funds. Returns have not kept pace during the 2019 YTD bull market, but returns have been attractive and with less volatility in most cases. Put more simply, these funds are doing what they are intended to do – provide attractive returns with less risk.
Exhibit 2. Summary of Alternative Mutual Fund Returns
What’s Next? Growing The Alternatives Market
There are a number of factors that could help the alternative mutual fund market grow into the $50B-$100B market we had originally envisioned. Broader participation from managed solutions (fund-of-funds), which account for $555B of AUM; advisor education and awareness; performance track records leading to more favourable dealer risk ratings; the launch of more alternative mandates through an ETF wrapper; more relaxed proficiency requirements for MFDA planners; and a change in market conditions that supports the benefits of investing in uncorrelated strategies. The right ingredients are in place to support AUM growth and there are a number of potential developments that could see growth accelerate. Stay tuned.