
Watch the yield curve for signs of recession risks
By Blu Putnam, Chief Economist and Managing Director and Erik Norland, Senior Economist and Executive Director, CME Group
Published: 13 April 2017
All examples in this report are hypothetical interpretations of situations and are used for explanation purposes only. The views in this report reflect solely those of the authors and not necessarily those of CME Group or its affiliated institutions. This report and the information herein should not be considered investment advice or the results of actual market experience.
Judging from the intensity and polarization of America’s political debates as well as developments in Europe, one might imagine that the financial markets would be roiled and in a state of high volatility with wide credit spreads and expensive options. Nothing could be further from the truth. Despite the various controversies taking place in Washington and the potential political upheaval in Europe, U.S. markets have been placid, with risky assets such as stocks, corporate credit and industrial metals, generally trending higher with relatively low volatility and options premiums, coming at the expense of flight-to-quality assets such as government bonds and gold which have seen their prices move lower (i.e., yields higher). And, the U.S. economic expansion appears quite healthy and robust.
Figure 1: US GDP Growth Periods.
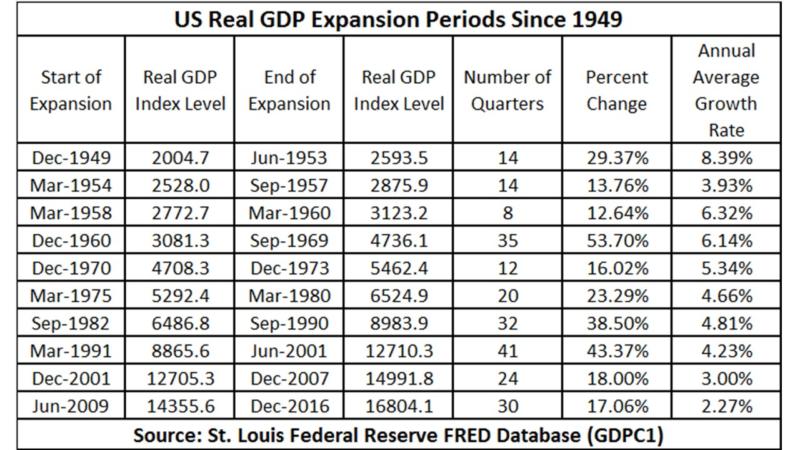
We note that the current U.S. business expansion, which started in mid-2009 has been quite durable, albeit with only modest real GDP growth (Figure 1). If the expansion can make it through the end of 2018, it will be the second longest of 10 growth periods since WWII, at 38 quarters, just behind the 41 quarters of the 1990s expansion that managed to extend itself marginally into the 2000s, and ahead of the 35 quarters posted in the 1960s. Also, one may note that the annual real GDP growth is on a declining trend. This is due to much slower labor force growth, aging of the population, more sluggish labor productivity growth, and the constraining effects of much higher debt loads as a percent of GDP.
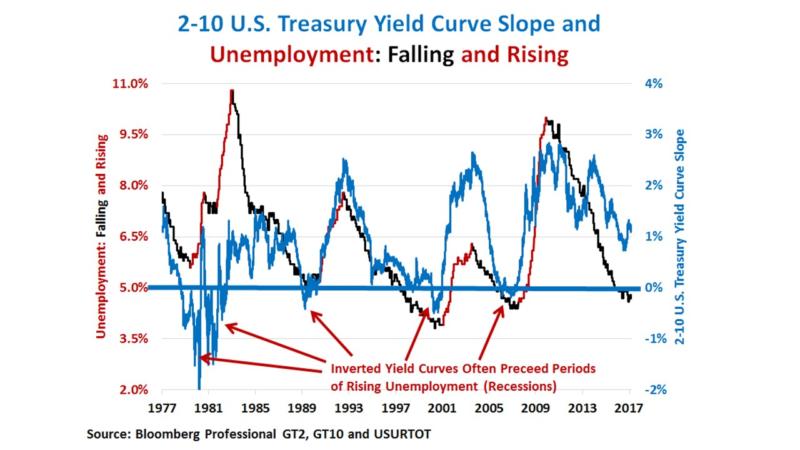
Just because an expansion period is getting a little long in the tooth, though, does not mean a recession is inevitable. With the benefit of hindsight though, it is obvious that all growth periods eventually come to an end. And, the expansion periods do tend to have many variations on the underlying cause of their demise. Nevertheless, and while not perfect, there is a common warning sign that recession risk is rising; namely the shape of the yield curve. When yield curves flatten and then become inverted, with short-term rates rising above longer-term bond yields, they can often signal a recession in the next 12 to 18 months (Figure 2). And, with the recession, there is usually a period of much higher equity volatility.
Figure 2: Inverted Yield Curves Preceded Each Employment Recession for at Least the Past 40 years.
Yield Curves as Warning Signs
At the moment, there are still 120 basis points (bps) of spread separating two and 10-year government bond yields—about 20 bps higher than the historical average for the past 40 years. This suggests that the U.S. economy is nowhere even close to a recession and that a downturn in 2017 is improbable, although not impossible. That said, each Federal Reserve (Fed) rate hike means short-term rates are on an upward path. The yield curve will start to flatten when bond yields no longer move upward as the Fed continues to raise rates.
Yield curves matter because, traditionally, banks and other financial institutions have depended, in part, on positively-sloped yield curves to boost earnings. To the extent financial institutions are willing to accept interest rate risk, they can fund themselves in the short-term from depositors or other lenders at a price close to the central banks’ policy rate and then lend longer term at a higher rate for a profit. So long as the yield curve is positively sloped, their long-term loans earn a term premium over the cost of their short-term borrowings.
If the appetite for interest rate risk is low, financial institutions can still earn profits from using their borrowed funds to make loans at higher prices to entities with lower credit ratings, thereby earning a risk premium without explicit interest rate risk. Credit risk, however, typically comes with embedded interest rate risk. The borrowers are often highly leveraged or have very risky cash flows. The embedded interest rate risk shows up delinquency rates and bankruptcies. Also, as short-term rates approach zero, there can be a compression of interest rate spreads that negatively impact bank earnings.
Finally, financial institutions can charge fees for their services to help boost profits. Fees can be interest rate sensitive, too. For example, mortgage servicing rights produce fee income, but that income can disappear if rates fall and the mortgages are refinanced earlier than expected.
The relationship of yield curve shapes to economic activity has appeared to shift over time. There are several possible reasons. However, we would like to focus on the rise of interest rate risk management sophistication and activity, tighter regulation of bank capital, as well as the trend toward ever-higher debt levels in the economy. These three factors all work differently in how they have affected the influence of the yield curve on the economy.
Back in the 1950s, 1960s, and 1970s, interest rate risk management was relatively unsophisticated. Lending institutions mainly emphasized maturity gap analysis, comparing the size of their bucket of short-term liabilities, often defined as maturities under one-year, to the size of their bucket of loans of one-year maturity or longer. This “bucket” approach to measuring interest rate risk gave the Fed considerable power to tame an economy they considered was overheating. When the Fed raised short-term rates and inverted the yield curve, bank profits declined rather quickly and precipitously, so they curtailed lending. Home mortgage lending, especially, was hit hard by an inverted yield curve, and recession were often characterized by a housing cycle related to interest rates and the yield curve.
The seeds of change in the appetite for interest rate risk and the way financial institutions managed those risks came in the 1970s. What had been missing in earlier decades were the tools for interest rate risk management. Under the guidance of CME Group Chairman Emeritus Leo Melamed, the exchange launched foreign exchange futures in the early 1970s once the Bretton Woods system of fixed exchanges rate broke down. Exchange-traded currency futures started the revolution in financial futures. Long-term bond futures contracts were introduced in the mid-1970s, followed by short-term Eurodollar deposit futures in the very early 1980s. At the same time as the exchange-traded interest rate futures markets were developing, over-the-counter markets developed for interest rate swaps to shift interest rate risk from one counterparty to another.
With the tools at hand, financial institutions gradually evolved in their interest rate risk management sophistication. The home mortgage market was particularly impacted, as risk management tools allowed for specialization in different aspects of the market, such as loan origination, loan servicing (i.e., collecting the payments), and taking the interest rate risk. The net impact on monetary policy was to reduce the effectiveness of interest rate policy as a tool to control inflation, as financial institutions simply evolved into less interest rate sensitive entities. Note that “less” interest rate sensitive, does not mean “zero” sensitivity, as interest rates remain very important for bank profits, just not in the same way as in the 1950s and 1960s.
Regulating bank capital ratios has increasingly become the tool of choice by regulators to limit the exposure of the financial system to risks emanating from the financial system. This type of prudential regulation has probably worked to reduce systematic risk emanating from the financial sector, although not without unintended consequences. With tighter limits on bank capital ratios, monetary policy is now less able to provide stimulus to the economy. That is, the Fed can lower short-term rates, and even purchase US Treasury and mortgage-backed securities in size (i.e., Quantitative Easing or QE), and yet the impact on the economy is quite limited, even if the impact on asset prices is substantial. The issue is that once financial institutions are constrained by capital limitations, their lending will not automatically increase with lower short-term rates, and central bank asset purchases directly raise asset prices, such as equities and bonds (i.e., lower yields) without any knock-on impact to lending and economic activity.
Our conclusion is that while more sophisticated interest rate risk management and tighter capital ratios have worked to reduce (not eliminate) systematic risk from the financial sector, these two developments also have worked to diminish the potency of monetary policy. However, the shape of the yield curve remains a very useful indicator of a future recession. The reason is heightened debt loads in the economy.
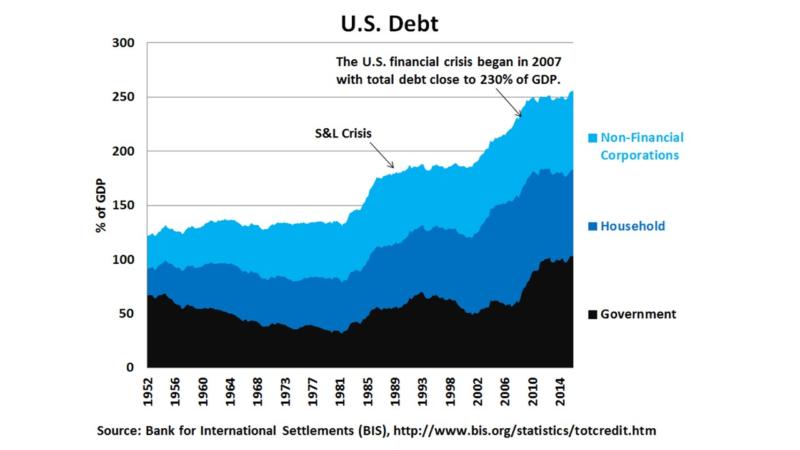
The U.S. economy still has a mountain of debt, which continues to grow. In the wake of the 2008 financial crisis, there was never any net deleveraging for the whole economy. Private sector debt did fall as a percentage of GDP for a time but it was more than offset by a corresponding rise in public sector debt (Figure 3). In this regard, the U.S. is not alone or exceptional. Most of the developed world, including the Eurozone, Japan and the UK, are in a similar boat. Australia, Canada, China and South Korea are climbing aboard similar debt-laden boats, too.
A high burden of debt on an economy increases its sensitivity to interest rates and means the yield curve is likely to maintain significant predictive power related to the probability of future recessions. Interest expense rises with higher rates, and the more debt the economy has, the more vulnerable to higher rates. Heightened interest rate risk management does not reduce the overall level of interest rate risk in an economy, it merely moves it around to those with the appetite to take and get paid for taking interest rate risk and shifts the risks away from those that prefer to focus on other ways of earning returns. Similarly, tighter capital ratio regulation on financial institutions may work to reduce systematic risk coming from the financial sector. However, it will increase financial risk-taking in non-bank and differently regulated sectors. We think of this as the balloon theory of risk conservation. Due to underlying causes from economic risks, political risks, natural disasters, etc., there is a certain amount of risk in the overall economic system comparable to the total amount of air in the whole balloon. When regulators squeeze part of the balloon, the air (i.e., risk) goes to another sector.
Figure 3: Will Another Leveraging Cycle Boost Growth?
How Might the Yield Curve Move in the Future?
Knowing when the yield curve will flatten and possibly invert is key to determining the timing of the next recession, credit risk explosion and equity volatility spike. All of those phenomena tend to happen within about 12 to 24 months after the yield curve inverting.
By way of the obvious, there are two factors that determine the yield curve’s shape: short-term, and long-term interest rates. Short-term rates are determined largely by the discretion of the central bank. The Fed, being data-dependent and skittish, is easily influenced by changes in economic data and in equity and bond market prices.
In 2015 and 2016, the Fed hiked its Federal Funds rate target range at the painfully slow pace of 0.25% per year. The Fed now appears on a much more rapid path to higher short-term rates. Even if they did four hikes this year, it probably would not flatten the yield curve, depending upon what happens to longer-term yields.
The other determinant of the shape of the yield curve, longer-term bond yields, are not so much influenced by Fed rate policy as inflation expectations and bond-equity trade-offs. Inflation has crept higher, moving above the Fed’s 2% long-term target by several measures, if not yet by the Fed’s favorite Personal Consumption Expenditure (PCE) price indicator. And, equity markets have rallied since the U.S. election on hopes of tax cuts, infrastructure spending, and lighter-touch regulatory policies, while bond yields have risen (i.e., prices have fallen). If inflation continues to creep higher and if the equity market sustains its rally, it is easy to imagine a parallel upward shift in the yield curve as the Fed raises its target range for the Federal Funds rate.
The current situation, with the Federal Funds rate below 1%, inflation rising above 2%, unemployment relatively low, and longer-term yields on the U.S. 10-year Treasury above 2.5%, there is a good case the yield curve will remain nicely positively-sloped in 2017. While Fed tightening has been a cause of an inverted yield curve and a subsequent recession many times in the past, at least for now, the very slow removal of monetary accommodation by the Fed simply does not suggest a shift to a flatter or inverted curve.
If the yield curve is going to flatten or become inverted, the likely cause may come from factors impacting longer-term bond yields. This means that the source of a bond market rally that works to flatten the yield curve and signal greater recession risk or higher equity market volatility is likely to come from an economic disappointment. We are not suggesting a bond rally and potential recession is likely any time soon; however, our radar has turned to monitoring potential sources of disappointment relative to expectations. In this regard, we are closely assessing fiscal policy. Our judgment is that equity markets have incorporated meaningful expectations of lower corporate and personal income taxes, as well as modestly improved economic performance. Therein lies the risks to the currently benign outlook.
What if it is a mistake to think that we will even see a fiscal boost at all. The Republican majority in Congress has decided to begin its term by tackling health care. If Republicans get it done, they will likely proceed with tax reform next. However, if the effort to reform health care is delayed or fails, it might damage the Republican Congress’ ability to pass other legislation. We note that changing the Affordable Care Act is difficult and risky. Already there is push-back from all sorts of interest groups, not least of whom are the people who gained access to health insurance as a result of the law, not to mention hospitals, insurers and other groups. The next few months will probably determine the future of health care legislation.
Tax reform will be just as big of a challenge. While there is widespread agreement that the 35% tax rate on corporate income is aberrantly high, there is little consensus on what do to about it. Should the Congress simply cut the tax rate to 15% or 20%, as promised during the campaign, or should they cut the corporate income tax rate in exchange for adding a border tax adjustment which would make the package revenue neutral by no longer permitting the cost of imports as a deduction? Already, powerful opposing groups within the Republican Party are spending money lobbying for and against such an adjustment.
Reducing individual income tax rates either by closing loopholes, or not, poses similar dilemmas and will also be a challenge to get through Congress. The same can be said of infrastructure spending. Will it be achieved simply by having the Federal government borrow more money to finance the construction of roads, bridges, tunnels, airports and train lines or will it also involve privatization of public infrastructure? Will any of this pass through Congress? The Democrats are nearly united in opposition. This means that for legislation to move, there has to be near unanimity among the Republicans in both the House and the Senate as well as agreement from the Administration.
The answers to these questions matter for numerous reasons. Not least of these is that the more fiscal stimulus that gets enacted, the more the Fed is likely to raise rates. The more the Fed hikes rates, the more likely the yield curve eventually flattens and inverts to the probable detriment of those invested in high yield bonds and other risky assets as well as those who are short volatility. The sooner the yield curve gets to flat or inverted, the sooner the U.S. is likely to experience the next recession.
With so many moving parts, including fiscal policy and the psychology of investors, putting together a timeline for this is difficult. That said, it appears unlikely that 2017 will see a recession. We expect that growth will continue to muddle along in the 1.5%-2.5% range with some further decline in the unemployment rate and modest further upward pressure on wages and core inflation. That said, 2017 might see an increased likelihood of credit spread widening and volatility spikes (both implied and realized), especially if the Fed continues to hike rates at anything close to its new once-every-three-months pace.
The critical year is probably 2018. By 2018 we will know the extent of fiscal stimulus. Particularly, we will know if another round of federal debt finance is spiraling upward, taking the U.S. national debt toward 120% of GDP, or whether health care and tax reform have been handled in a revenue/expenditure neutral manner.
Fiscal stimulus with higher national debt raises the sensitivity of the economy to higher rates. We expect a new Fed Chair and Vice-Chair in 2018, but given the Fed tightening cycle, fiscal policies increasing the national debt might raise the risk that the yield curve finally goes to flat or inverts, presaging a much more volatile period for investors towards the end of the decade and possibly the next recession.
The other possibility, of more or less revenue/expenditure neutral policies from Congress, suggests the equity market may not get the fiscal stimulus it currently expects. And, if tax reform includes a border tax, there is the possibility of trade policy retaliation in the world. A disappointed equity market and lowered economic growth expectations could bring the type of flight-to-quality rally in bonds that flattens the yield curve and raises the probability of a future recession. Put another way, markets face considerable policy ambiguity, and depending on how the ambiguity is resolved, the current calm may give way to volatility. Time will tell. However, we know to watch the yield curve for storm warnings.